Active vs passive – it is both and… not either or


Kent Grobbelaar
Head of Portfolio Management (Offshore),
STANLIB Multi-Manager
Doesn’t this quote from the 2013 Berkshire Hathaway report make you think of the song; “Isn’t it ironic”? If Alanis Morissette released her chart topping single 15 years later, there is a chance the lyrics would not start off with a 98-year-old man winning the lottery and dying the next day. Instead it might be about an 83 year old endorsing an Exchange Traded Fund despite being the most successful active manager of all time. The objective of this article is to provide insight into the inclusion of both passive and active investments within global portfolios.
Background
While the advent of a stock market index such as the Dow Jones Industrial Average can be traced back to 1896, it wasn’t until the 1950’s when Markowitz introduced the world to Modern Portfolio Theory, and Fama in the 70’s who presented us with the notion of the Efficient Market Hypothesis, that the basis for investing in a style that today is commonly referred to as passive was born. Subsequently Malkiel and Ellis both put forward the case for investing in indices calculated on a market cap basis as an alternative to an active manager.
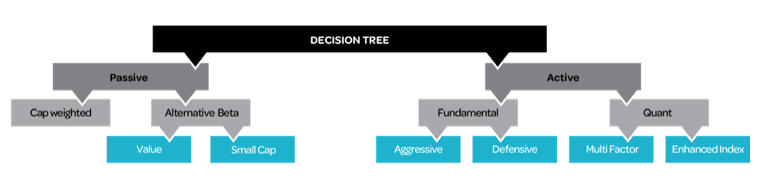
There are an infinite number of ways in which one could specify the constituent weights in an index so despite the debate around what constitutes passive, we subscribe to what the finance industry means by beta. In this regard we assume it is the risk one takes when investing in an index tracking fund where the constituents are weighted according to their market capitalisation. There is also sufficient academic evidence to support an alternative source of return where risk premia can be harvested systematically. We have lumped all of these factors together into a separate bucket called alternative beta.
The decision tree for investors therefore looks something like the diagram below:
A swing and a miss
Let us try understand why the Sage of Omaha (Warren Buffet) may have made the aforementioned comment. To do this we look at SMMIS – GE (STANLIB Multi-Manager Indicator of Success – Global Equity). In the table below SMMIS compares global equity portfolios in the Morningstar database and highlights the number of funds in the universe, the average relative performance and the percentage of funds that beat the benchmark.
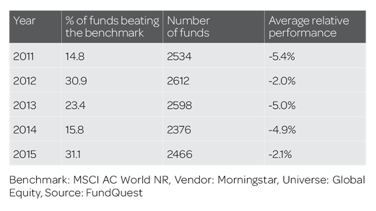
From this it is clear why Buffet could have made the statement. Take 2011 as an example – only 14.8% of the 2534 funds beat the MSCI AC World Index after fees. On average they underperformed by 5.4%.
Similar results which back up our analysis can be found in the S&P SPIVA scorecards. The US (which represents half of the world’s stock markets) highlights 84.2% of mutual funds underperformed the S&P 500 over the last 5 years.
To be clear this does not mean active managers cannot add value – not all managers are average (see example below) and it only takes into account the most recent cycle whereas we prefer looking at five or six cycles going back to the 70’s.
Also note 100% of cap weighted passive managers would under-perform after fees, spread costs, index rebalancing charges, withholding taxes and admin expenses as well as trailer commission.
Portfolio construction
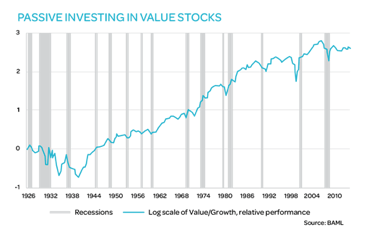
We believe the magic lies in how you pull the opportunity set together into a solution for clients. Let us start with the passive decision, should you go with a market cap or alternatively weighted vehicle? We think the latter. Take the value premium as an example, a patient investor would have been rewarded over the long-term by investing in value stocks passively. The graph below indicates that value has outperformed.
The problem is the risk of relative drawdowns is material. After all, academic theory suggests a premium usually exists as a result of a risk. So while alternative beta indices have the potential to provide outperformance, we need to carefully analyse and manage risks. Index providers spend a lot of time comparing their indices’ performance against cap-weighted counterparts but rarely take into account tracking error risk budgets.
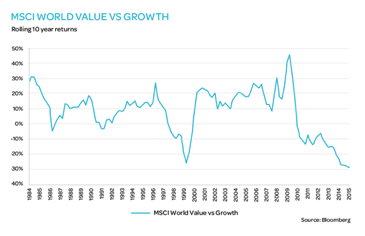
In this regard if one looks at the graph below, you will see that the magnitude of the downturn in value, on a rolling 10 year basis, was around 30% when the Tech bubble burst in 2000 and post the financial crisis in 2007.
An additional challenge is that due to the poor performance of active management, there has been a flood of money into Smart Beta funds. In fact new product launches have dwarfed almost every other fad.
Maybe it is too early to call, but our sense is there is a risk of a bubble brewing in this space. Consequently, valuation levels of certain factors are elevated, which in turn could reduce future return potential or increase risk if we see mean reversion. Of all the recognised premia, only value stands out as cheap – see below.
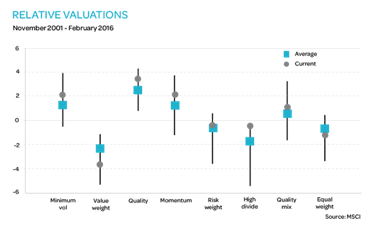
Based on price to earnings, price to book value, price to cash earnings and price to sales at month end dates. Values below 0 indicate the factor is cheaper than the parent. A current value below average indicates that the factor is cheap relative to its own history. The line endpoints indicate historical minima and maxima.
A word of caution therefore is to consider the herd mentality as many factors have rerated.
Our approach would be to target a factor, which is robust over numerous decades, supported by academic research, applicable across regions and importantly, cheap/ripe for harvesting. Take a look at Richo’s article where he elaborates on how to choose the correct Passive fund.
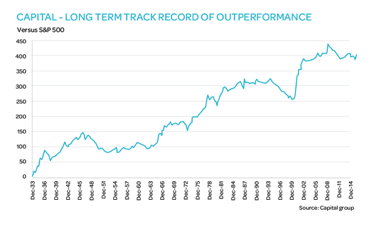
The other side of the equation is how to blend the passive component of your portfolio with active managers. We think it should ideally compliment what your stock pickers are doing. As an example we have taken one of our managers (Capital) which has a similar, albeit better, long term track record to the aforementioned value index.
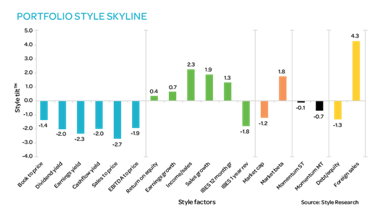
At the moment, Capital has a structural overweight to Technology companies and is underweight more cyclical areas of the market such as Materials. You will see from the portfolio skyline below, the blue bars show their anti-value orientation while the green bars confirm the growth bias. If one drills down further though, there are a few other factors to consider such as a small cap (orange), momentum (black) and quality bias (debt to equity in yellow).
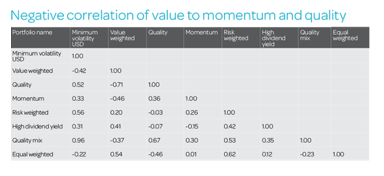
If in the above example we blended this active manager with a value weighted passive mandate, the diversification benefits become even more apparent if one looks at the matrix below showing the negative correlation of value to the aforementioned exposures of momentum and quality.
One final thought on portfolio construction; debates have centered on whether active is better than passive but maybe the focus needs to be on periods when active managers are more likely to outperform. The outcome for active managers is after all partly dependent on the available opportunity set and there is evidence they can generate outperformance when cross sectional volatility rises. We have tried to take advantage of this by dialing up our active exposure.
Conclusion
“The stock market is designed to transfer money from the active to the patient.”
– Warren Buffett
Note Buffet’s quip is not about transferring money from the active to the passive. It is about being patient. We believe combining the right passive (if you want to define it loosely) whereby you implement rules based, transparent and low cost exposure, with proven active managers is a winning strategy. The caveat being one must adopt a holistic approach and portfolio construction is vital.
Before implementing alternative beta solutions, one needs to consider the change in the value chain. Instead of sub-delegating to a manager, the responsibility shifts up a level to the investor and you need to be aware of the risks. On a relative basis it is possible that investors are overpaying for exposure to certain factors and are leaving opportunities on the table.
Utopia in implementation would be a completion portfolio which decreases risk while enhancing return.