
How much can you draw from a given lump sum?
Introduction
The most important objective in saving for retirement for the average individual would be to live comfortably in retirement and not to outlive one’s money. A secondary objective may be to leave an inheritance for children or grandchildren. One of the biggest problems faced by pensioners is the fact that people on average live longer today than ever before in human history. South Korean women are now the first sub-population group to have breached a life expectancy at birth of 90 years.
Before the 19th century the average life expectancy at birth fluctuated between 30 and 40 years old. Life expectancy at birth (in developed countries) has improved by an average of three months per annum over the last 150 years, increasing life expectancy by more than 37 years. Some scientists even predict that children born today could easily live a healthy lifestyle
beyond 100, given the exponential growth in technological advances. Some even believe that the first person to reach 150 years old could already be older than 40 today.
The result of this higher life expectancy is that we need to provide for income for far longer and either need to work until later in life, or save more while we work. While longevity risk cover can be bought from life assurance companies in the form of life annuities or pensions, these too will become increasingly expensive as people live longer.
The focus of this article will be on the longevity of an investor’s savings, once he or she retires. However, holistic financial planning is crucial for any investor and other aspects of financial planning should also be considered like car and house insurance, medical insurance, life insurance, disability cover, dread disease, funeral cover, estate and tax planning, etc.
Modelling income
The longevity of an investor’s retirement savings is driven by a few important factors:
- The aggregate amount of savings;
- The amount required to live on each month;
- How the savings are invested, and the resultant investment returns; and
- Inflation, which erodes the purchasing power of those savings.
For illustration purposes in this article, I will use a value of aggregate savings at retirement of R3 million. This is not meant to be representative of the average South African, but all monetary values can be scaled in this article to match your financial situation. So, for example, if you are fortunate enough to have savings of R12 million at retirement, just multiply the monetary values mentioned below by a factor of four. If your savings are R1 million, divide the values by a factor of three. For simplicity I have ignored tax, a very important consideration for individuals with higher savings and income requirements. However, tax implications on the R3 million investment amount should be minimal for reasons that will become apparent later when we consider the level of income (in South Africa, from 1 March 2017, the tax threshold for people between 65 and 75 years old is R117 300).
Depending on an investor’s risk profile, he or she could choose to either invest this R3 million conservatively, aggressively, or anywhere in between these extremes (at this point, we are ignoring the translation of these loosely defined terms into more concrete investment strategies, but we will consider this more precisely below). This decision will be driven by multiple factors, and one industry view is to consider the investor’s trio of risk factors, namely risk tolerance, risk capacity, and risk required.
Finding the correct asset allocation is critical, too high an allocation to cash is typically not appropriate regardless of age (except in exceptional circumstances), as cash will not give you a significant real return to withdraw from (around 1% in the long-run above inflation) while maintaining the real value of the capital over the long term. An exception to this could be if you have a very large investment with little requirement for income and very low risk tolerance. However, I must reiterate that every individual’s situation is different and should be discussed with a financial adviser.
For our exercise, we will assume that the investor invests in a fund that is expected to yield a 4% real return over the long run. It is important to realize that assets that guarantee this level of real return don’t exist and that the actual return can therefore be very different to this on an annual basis (and even over much longer periods of time).
In Chart one to the top right, we used a randomly selected (but representative) unit trust fund from the ASISA SA Multi-Asset Low Equity Category to show how volatile the returns have been over time. The chart shows rolling returns relative to an inflation plus 4% p.a. (CPI+4%) objective over various rolling periods since June 2001. Note how, over a 12-month period, the fund underperformed the CPI+4% objective significantly in 2003 (end of the bear market), between 2008 and 2010 (GFC) and again in 2016. At other times it outperformed this objective by quite a large percentage.

The rolling five-year return line shows more consistency, but still highlights five-year (60-month) periods where the objective was not met. In fact, the annualisation of returns somewhat masks the extent of this under-performance, which was as high as 18% for the five years to the end of April 2012 on a non-annualised basis. Over rolling 10 year (120-months)periods it is evident that this fund met the CPI+4% target over all historic periods – however, this is not a guarantee that it will continue to do so in future, even if longer periods are considered (in fact, we can calculate the probability of this happening under certain assumptions as being 4% or odds of one in 25). Selecting the correct investment vehicle managed by a reputable multimanager with the appropriate risk profile is still critical in meeting financial needs.
Simplistically, if we assume she can achieve a 4% p.a. real return from the R3 million investment and only draw this 4% each year from the capital invested (R120 000 p.a. assuming the R3 million), theoretically her money should grow with inflation every year and her purchasing power will be maintained, suggesting her capital should last indefinitely. If she withdraws more
than the 4% every year, her purchasing power will gradually decrease as she starts “eating” into her capital, and if she withdraws less than 4% every year, her capital is expected to grow faster than inflation.
Unfortunately, as shown in Chart one above, the market does not deliver returns so neatly, something generally referred to as “market risk”. If she happened to retire just before the global financial crisis and her portfolio lost say 20% of its value through the crisis (something that the above fund didn’t do), they would now only have R2.6 million. The dilemma is that such an
investor could start depleting her capital at a much faster rate, as she now needs to withdraw more than 4% of her portfolio to maintain her standard of living.
Unlike many other examples in the media showing how an investment would have done when back- tested over history, I thought I would do something slightly different. I ran 10 000 simulations of returns of a fictional CPI+4% portfolio, assuming volatility of the real returns of 5.7% p.a. This volatility is consistent with the historical volatility of moderately conservative
investment portfolios. The rational for this is that 10 000 simulated portfolio returns will provide us with additional insights into how a portfolio could perform going forward (parameterized using historical returns). This is essentially 10 000 different possible “versions” of the future, calibrated by history.

Chart two presents these simulated portfolio outcomes (y-axis) over a period of 30 years or 360-months (x-axis) using the initial investment amount of R3 million as the starting point.
The blue shaded area represents the simulated range of outcomes. I also assume he or she will withdraw an annual income of 4% of the initial saving, equating to R120 000 per annum or R10 000 per month, in real terms (all calculations are done in real terms). To clarify, R3 million invested at the start of the period is equivalent to R3 million after 30 years after adjusting for inflation.
The same applies to the withdrawal amount. We assume a R120 000 annual withdrawal in real terms. The actual rand amount withdrawn in future will be much higher than this, due to inflation, but we assume the purchasing power remains the same.
It is critical to make the assumption that a similar withdrawal will be made in real terms as this is the amount he or she would require to maintain his or her standard of living.
The middle black line is the average of all the simulations at each point in time. Our initial investment is R3 million and the average investor’s real capital value should stay at R3 million as the annual real return of 4% p.a. is the same as the annual real withdrawal amount of 4%, so she is only consuming the return in excess of inflation.
The red line represents zero capital, meaning she runs out of money and therefore income. Simulations above the upward sloping blue line represents the 5% best results, at each point in time. Simulations below the downward sloping blue line represent the 5% worst results, which means that 95% of simulations lie above the downward sloping black line. As can be seen
on the chart, the downward sloping line does not breach the purple zero capital line, which means that for more than 95% of all simulations, capital is not expected to be depleted (or that the probability of depleting capital is less than 5%).
Also note how some of the simulations start breaching the red line just after the 23 year (280-months) mark. This is important because it highlights that low probability events happen all the time, and this unfortunate event is a real (even though unlikely) event. Given this risk of being invested in such an unfortunate period or simulation, there are a few measures commonly
recommended to investors to improve chances of outliving capital. We will explore three options.
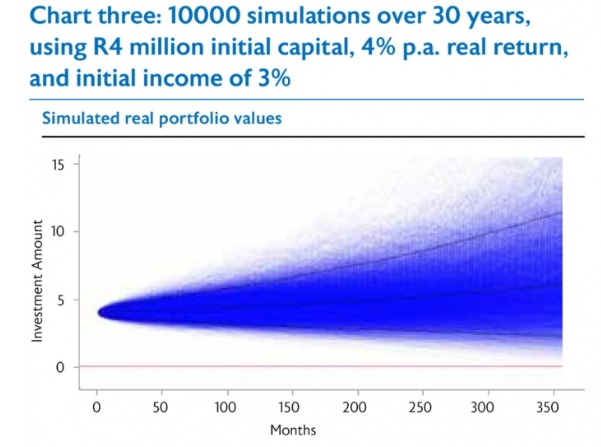
Option one: Begin with a bigger lump sum
Ensure the investor has enough capital at the start to allow him or her to withdraw a smaller percentage. For example, if the investor has R4 million at the start of the investment period, he or she would only need to withdraw 3% p.a. to still get an income of R120 000 p.a., if we maintain the capital invested to yield 4% p.a. real. The median capital value is now expected to
grow in real terms indefinitely, and expected to reach approximately R6 million (in real terms) in 30 years.
In fact, none of the simulations ran out of capital over 30 years, although this should not be misunderstood to mean that this could not happen. All else being equal, the lower the withdrawal percentage, the longer capital will last on average. Although this may not be an option at retirement, it is nevertheless a good concept to understand as it can be factored into retirement planning i.e. set the goal/objective higher long before retirement and invest more aggressively when you have a very long time horizon to increase the chances of having a higher lump sum at retirement.

Alternatively, an investor could reduce the income required in retirement, by making certain adjustments to living standards i.e. by spending less on “luxury” goods and focusing more on necessities. For example, withdrawing 3% instead of 4% of the R3 million equates to R90 000 p.a. or R7 500 per month. Given these parameters, in all simulations the capital comfortably lasts the full 30-year period, while the expected capital value goes over R4 million after 30 years.
Option three: Invest more in growth assets i.e. more aggressively
The final alternative we will consider, is for the investor to invest in a portfolio with a higher expected return i.e. a portfolio with a higher allocation to growth assets like listed property and equities. However, these portfolios will on average have higher volatility of returns, which means that their returns from day to day, week to week, month to month, are more uncertain.
They therefore have a higher chance of yielding negative returns, and these negative returns can be larger. This also means that the expected range of outcomes, positive and negative, becomes wider. Investors should therefore understand this risk really well to establish whether they have the tolerance and capacity for it.
Below we explore this option, now assuming an expected real return of 5% per annum and a corresponding real volatility of 8% per annum. From the graph it is evident that the chances of outliving capital for the 5% worst simulations did not improve over our original example. It in fact became even worse, with some simulations depleting capital after just 21 years, which clearly demonstrates the risk discussed above. We do however find that the expected capital value after 30 years is now higher at approximately R5 million.

Range of outcomes
The above examples used very specific assumptions for the simulations. I thought it would be useful to demonstrate the period an investor’s capital is expected to last (the middle black line in the previous examples), given various real return and initial withdrawal rates. The results from these simulations are captured in the table opposite. For example, if an investor invested in a moderately aggressive portfolio, expected to provide a real return over the long term of 6% per annum (last row) and withdrew an initial income of 10% of the capital invested (last column), she could expect that the average outcome would see her capital last less than 15 years. These are the results that were derived from 10 000 simulations, but the investor would only experience one of these (or technically, none of these but rather some other random variant). It is therefore important to understand these scenarios in probabilistic terms.

Conclusion
Theoretically, if an investment is expected to return 4% in real terms p.a. and the initial withdrawal from such an investment is also set at 4%, an investor’s initial investment should last indefinitely. However, investment markets are risky and investment outcomes are not always as expected, as markets tend to be volatile or uncertain. This uncertainty poses a dilemma for pensioners at retirement, specifically given that life expectancy is continuously increasing. In my analysis I considered a 30-year time horizon post retirement, to illustrate what could happen over this period under different assumptions.
Using thousands of simulations, I showed how an unfortunate investor could deplete her capital if markets suffered significant drawdowns (negative returns) during the period of investing. I then explored various options to counter this potential capital shortfall, suggesting that an investor either saves more during her career to increase her capital investment at retirement, or
reduces her standard of living once in retirement. The key here is that the withdrawal amount in real terms should be less than the expected real return, allowing for a ‘buffer’ which will combat market uncertainty. I also illustrated how a retiree could increase the riskiness of her portfolio, without increasing the risk of depleting capital by much. This option does come with additional risk, especially if the investment horizon is short.
This article contains many simplifying assumptions that won’t necessarily apply to every individual. Saving enough for retirement is critical and an investor should be comfortable that she will have enough capital to invest to allow a withdrawal of income, without depleting capital. As previously mentioned, we did not cover other important aspects of financial planning which most investors should talk to a professional financial adviser about.
Richo Venter
STANLIB Multi-Manager: Portfolio Manager