Fees alone cannot be the driver of improved performance

“Price is what you pay. Value is what you get.” – Warren Buffet
Is the cheapest really the best? If so, why do all of us not just buy the cheapest smartphone or car? Sometimes the cheapest represents poor quality or value for money. Other times it may just include fewer features. Why should investments be any different?
Often we are asked to focus on fees and are told how they erode total returns, rather than being asked to focus on value, which is represented by net returns. Net returns are what you actually get, as opposed to fees, which are what you pay. We are hearing more frequently about price these days in the investment environment. Clients are more informed and want assurance that they are getting the best price and are not being overcharged. Advisers feel the pressure from clients and have subsequently pushed the asset managers to ensure fees are reasonable. Some of our asset managers have taken up this theme, reduced fees, and marketed it as their differentiating factor. Others have maintained their value proposition and continue with the status quo. With this debate in the market, we ask, do lower expenses imply better returns?
A common argument in support of low fees is that all investments cost money and those with higher fees have more to overcome in terms of performance. Furthermore, the loss in terms of higher fees is compounded over time, resulting in a lower pay-out over the lifetime of the investment.
Although the costs of an investment are important, we believe that cost alone cannot be the driver for improved performance. After analysing performance and expense data, we have found that there is no relationship between lower fees and an increase in investment performance.
What does the data tell us?
We chose the ASISA Equity General Equity category (retail classes) from Morningstar for our analysis. Equity is the largest single asset class on a look-through basis, within the unit trust industry and a large portion of the managers in this category are active managers. The data that we consider in our analysis is the total expense ratio (TER) annualised and 5-year annualised returns. We plotted the data points in the chart that follows and inserted a trend line.
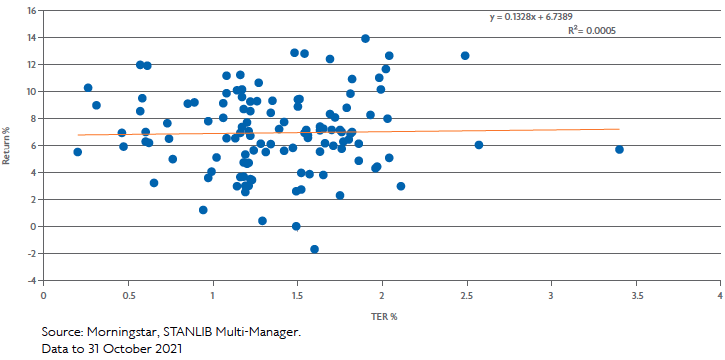
When looking at data like this, a quantitative analyst will seek to find whether a relationship exists. A common measure would be to do regression analysis and fit a trend line. They may also look at how well the trendline fits the data by looking at the R2 following the analysis. The R2 is used to measure the quality of the fit, explaining how much variability in the data is explained by the regression model. A higher number indicates a better fit, while a low number indicates a poor fit. Looking at the graph above no clear pattern emerges and the data points are scattered. The trendline is also relatively flat indicating no apparent relationship. The results of the regression model returned an R2 of 0.0005 indicating a very poor fit.
We further dissected the data and looked at it from a different lens, splitting the funds in the category into quintiles based on their respective TERs, looking at the average returns and average TER for each quintile – quintile 1 having the lowest average TER and quintile 5 having the highest. The results are presented in the table that follows.
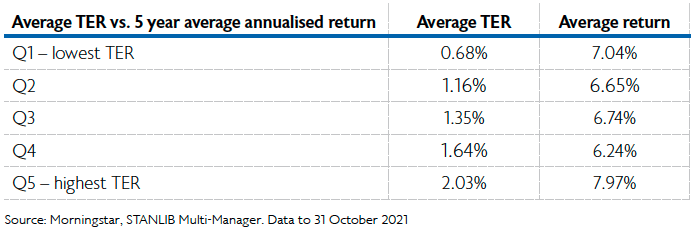
From the data in the table, we can see that the funds with the lowest average TERs do not perform the best and the funds with the highest average TERs have the highest return, despite their high TERs. The other quintiles do not show any pattern and hence, there does not seem to be a trend. To test this, we also ran an Analysis of Variance (ANOVA) to determine whether there are any statistically significant differences in the averages. We found no evidence of this i.e. the variability in returns overpowers any small differences in the averages.
We then looked at the data from another lens, this time ranking the quintiles by performance. The top-performing funds are in quintile 1 and the poorest performing funds are in quintile 5 and are represented in the table that follows.

Ranking the quintiles by performance does not show a different picture and no clear pattern emerges. Running an ANOVA again resulted in no statistically significant differences in the averages i.e. the highest performing funds did not have the lowest TERs.
We also ran regression models for other ASISA categories – MA Low Equity, MA Medium Equity, MA High Equity, and MA Income – and found the results to be similar with low R2 values. Hence there was no relationship between fees and returns in these categories. This may be in direct opposition to other articles that imply these relationships do exist, but these articles do not attempt to check whether the relationships exhibit statistical significance, they simply report on random outcomes.
Conclusion
From the data presented, we can refute the hypothesis that funds with lower expenses tend to outperform those with higher fees. Performing a regression analysis results in a very low R2 figure, indicating that there is no evidence of a trend. Looking at the data through various lenses did not show any difference either.
Although expense ratios are important when choosing an investment, they should not be the only factor in the decision-making process. Since investment expenses can erode returns over time, choosing a fund that offers the right value is much more important than only considering the fees. One cannot base expected performance on the expenses of an investment/fund.
Factors to consider include the philosophy of the manager and how this matches what one is looking for from an investment point of view. An investor needs to question whether the philosophy makes sense and whether the outlook of the manager resonates with the requirements of the investor. It is also useful to understand the process that the asset manager goes through to achieve returns – in short, this is understanding how they make money for their clients. Understanding the drivers of returns will inform an investor whether a fund is suitable for their needs. And finally, the people behind the investment decisions are also important; as well as knowing their track record and ability to deliver on investment outcomes. At the end of the day, active investing uses a range of assumptions to make a prediction of the markets. This requires skill to execute successfully and a range of factors should be used to evaluate a fund or an asset manager.