Benchmarks: ‘Keeping up with the Joneses’

EXECUTIVE SUMMARY
- Benchmarks provide a gauge which can be used to compare the performance of a fund and peer group benchmarks are often used as such a ‘measurement tool’
- When using peer benchmarks, one needs to be mindful of who/what is included in the peer group, survivorship bias, retail vs institutional fee classes and when to use the median and/or average of a category
- Peer benchmarks may be useful for measurement and decision-making, but historical performance should only be one input as part of the overall assessment of an asset manager.
As an investor, you probably come across the word ‘benchmark’ on a regular basis. You may have noticed this word on a fund factsheet or it may have come up during discussions with a financial adviser. While many clients are familiar with it, the concept can be quite puzzling at times.
If you search the word ‘benchmark’ in the Oxford Language Dictionary, it is described as ‘a standard or point of reference against which things may be compared’. The Merriam-Webster Dictionary describes it as ‘something that serves as a standard by which others may be measured or judged’. Simply put, from an investor’s perspective a benchmark provides you with a gauge against which to compare the performance of your fund. The CFA Institute provides the following guidance regarding the qualities of a good benchmark: It must be investable, specified in advance, appropriate, measurable, unambiguous, and reflective of current investment opinions. More information on this can be obtained from the CFA Institute’s website.
In this article, we briefly explain what a fund benchmark is and then focus on the specific one that we think is very useful. Throughout this article, we assume that a client is invested in a single unit trust fund. The investment could, however, also be a combination of funds or a model portfolio.
A wide range of benchmarks exist
Equity indices are often used as the benchmark for an equity fund. A well-known US example is the S&P500 Index, which tracks the 500 largest listed companies in the US. Locally, the JSE All Share Index is a widely used. Various other asset class indices are also available, such as bonds, property, and commodities. Composite or blended benchmarks are also popular – usually for balanced funds – and may include combinations of local and global asset class indices with predefined weights assigned to each index.
These benchmarks and many others are useful, but what about looking around the block to see how the neighbours are performing? This is called peer group comparisons. In South Africa we are fortunate to have ASISA categories, whereby each one of the over 1 000 locally registered Collective Investment Schemes – also called unit trust funds – with broadly similar asset class exposures are grouped together. These categories span a wide range of asset classes, risk profiles and regions. In addition, there are specialist categories such as equity sectors, property; and even more flexible categories.
In order for a fund to be eligible for inclusion, each category has specific requirements. To illustrate, one of the larger categories – where most of the higher equity local balanced funds can be found – is the ASISA South African Multi-Asset High Equity Category. To be eligible to be included in this category, the key asset class limits required are as follows:
-
A fund cannot have exposure to equities (local and global combined) of more than 75%
-
The total global exposure cannot be more than 30% (plus 10% exposure allowed to the rest of Africa)
Maximum 25% property exposure.
In addition, there may be various other limitations, including instrument exposure. To change a fund’s category is generally quite an onerous process for an asset manager and is a rare occurrence.
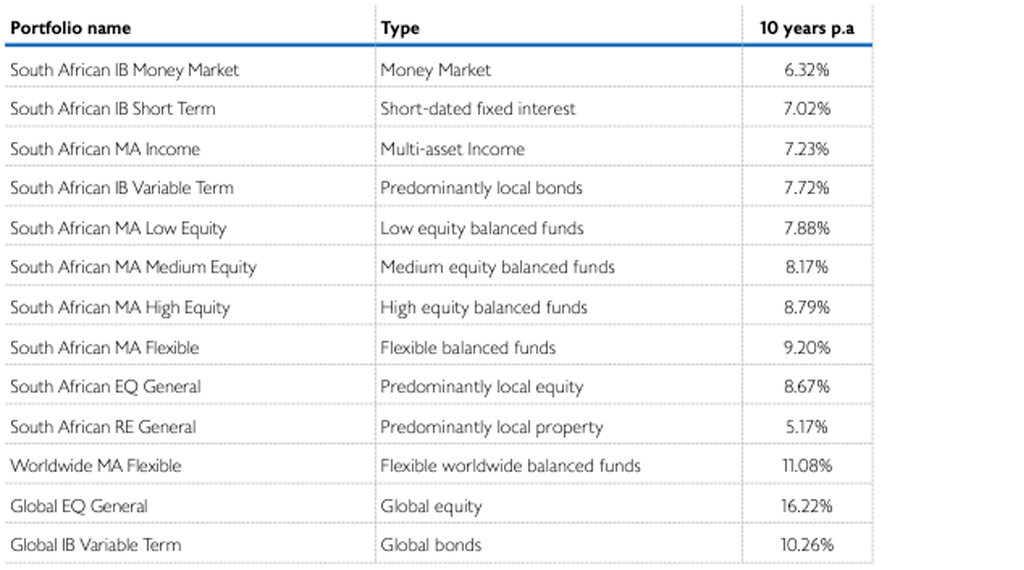
As can be gathered from the table, the average peer group category performance is a very useful measure. If an investor’s fund deviated materially from the category average – better or worse – over a certain period, it might require further investigation. Questions could include: was the fund selection(s) appropriate, was the style of the investment manager in or out of favour; or are there other factors at play? Another good example of how peer group performance can be used, is when a fund underperforms its outcomes-based objective i.e. its inflation rate plus objective. The past five years were challenging for investors in balanced and equity-type funds – funds with higher growth objectives – to beat inflation by a good margin. By comparing a fund’s performance to peers within its ASISA category, you will quickly be able to determine whether the underperformance relative to the fund’s outcomes-based objective was due to market conditions or unique fund-specific factors. If the performance is broadly in line with the relevant category average, the reason for underperforming is likely a result of the underlying asset classes not delivering the required returns above inflation.
Peer group comparison – what to look out for
If you are considering using a peer group category for performance comparison, there are a few considerations that should be taken into account:
- Some of the ASISA categories can be quite broad and there may be a wide range of fund differences within a category. Continuing with the High Equity category example, there are funds in this category with no global exposure, while other funds are positioned with maximum global exposure. Property exposure can also vary materially in this category. Therefore, if you are invested in a fund at extreme ends of a category, the comparison to an average might not be appropriate. In such a scenario it would be useful to understand why a fund is so different to the category average from both a risk and return perspective and whether you are comfortable with this. Once you understand these dynamics, the comparison could still be useful.
- Investors should be aware that many asset managers have specific benchmarks they aim to outperform and beating peer group category averages might not be one of these objectives.
- Many asset managers have the tendency to close underperforming funds or merge them into good performing funds, causing an issue of survivorship bias. If the history is not kept in the calculations, the average or median tends to be overstated as the underperforming funds have disappeared. Therefore, while it was previously suggested that it is good to beat the average (depending on how the average is created), it could become a difficult hurdle over time. And even by missing the average by a small margin, you as an investor might have achieved a relatively good outcome. Our estimates suggest that the returns for certain category averages could be inflated by between 1% and 2% per annum due to survivorship bias.
- Performance is shown net of all asset manager and funds fees, but advisory fees are usually excluded as this is a specific fee negotiated between client and adviser.
- There is a distinction between retail and institutional fees amongst fund and their fee classes. A typical individual investor should compare the performance of his fund to the retail category average.
- Sometimes peer group category performance is measured according to a ranking or median and not an average. While there are some calculation differences and both measures can be used, you should know the difference. Average can be skewed by outliers, whereas medians typically are not.
Past performance is only one consideration in the comparison
Investors should be aware that the best investment managers can underperform for periods of time and poor managers can get lucky and outperform for years. In addition, certain investment philosophies or styles can benefit or suffer from a specific economic environment. Category averages are useful for measurement and decision making, but historical performance should just be one input. Qualitative analysis such as understanding a manager’s investment philosophy, process and people should be another important input.
“The desire to perform all the time is usually a barrier to performing over time.” – Robert Olstein
In our opinion, in addition to measuring performance against a fund’s specific benchmark(s), peer group category averages can be a very useful performance benchmark. While looking over the fence to see what one’s neighbour is doing is informative, investors should not lose sight of their long-term outcomes-based objectives.