The diversification benefits of multi-managed portfolios


Richo Venter
Head of Research and Development,
STANLIB Multi-Manager
Multi-manager portfolios first came to light in the 1980s, but became more prominent as an investment model in the 1990s. A multi-manager does not invest directly in stocks, but appoints a number of portfolio managers – usually referred to as single managers – and spreads investments amongst these selected managers. Most investors, advisers and portfolio managers agree that investing in multiple asset classes including equity, cash, bonds, property etc. (generally called a balanced portfolio) provides a well-diversified portfolio for an investor. A multi-managed portfolio is based on the exact same principle – diversification, but amongst managers, to improve risk-adjusted returns for clients. Three levels of diversification are therefore achieved in a multi-managed portfolio: single manager diversification, asset class diversification and instrument diversification. Single manager portfolios only achieve asset class and instrument diversification.
One common mistake made by investors is selecting managers based on their past performance. Very few managers are able to consistently deliver great performance for various reasons (sometimes the seeds of future underperformance are actually sewn in great past performance). This means investors are at risk of choosing yesterday’s star managers rather than tomorrow’s. Optimal risk-adjusted returns are achieved through the selection of multiple managers with different investment philosophies and processes that are expected to outperform in the long run. By blending these managers at appropriate weights, improved risk-adjusted returns can be achieved.
Volatility and risk-adjusted returns
Volatility is calculated as the annualised standard deviation of the change in price (i.e. return) and relates to the uncertainty or risk of returns. If the price of a stock or portfolio changes by very different amounts (in percentage terms) over time, it generally has high volatility. If the price changes by similar amounts, it has low volatility.
A portfolio with high volatility therefore has more ups and downs and is more risky, while a portfolio with lower volatility provides a smoother return, resulting in a less risky investment i.e. in this particular sense, risk is proxied by the uncertainty of returns. It is however very important to measure this over appropriate periods of time and to consider whether the volatility is not capturing the “true” underlying risk in an investment e.g. writing deep out of the money call options may yield very low volatility of returns until the option expires in the money and bankrupts the investor. Cash is considered as a low volatility investment – each month you know with a high degree of certainty what your return from your cash investment will be, with very few (if any) default events. Regardless if stock markets crash, your cash return is still fairly predictable in most days, weeks, months and even years. Occasionally, you may have an event like the African Bank bailout, which may cause your “cash” investment to suffer massive losses, but these events are rare, especially relating to bank deposits. Shares have a much higher volatility. The stock market can be up 5% today and down 10% tomorrow (although this is fairly rare) and can be quite nerve wrecking for an investor who is not comfortable with swings in prices. As we all know,
it is very difficult to predict what the stock market will do next.
As an investor, a 10% expected return from a low volatility investment like cash is preferred to a 10% expected return from a much higher volatility investment like shares. A risk-adjusted return is a calculated measure that allows for a comparison between investments or portfolios with different volatility. It measures the amount of return per unit of risk taken. The Sharpe ratio is the best-known risk-adjusted return measure. You calculate an investment’s Sharpe ratio by taking the annualised return for the period under consideration (typically three years using monthly returns, but longer periods are generally favourable), subtracting the annualised risk-free rate over the same time period, and dividing the result by the volatility of the returns for the period.
Diversification explained
There is a well-known saying that “you should not put all your eggs in one basket”. This is why managers (or investors), will typically invest across many different companies’ shares and bonds, providing diversification across geographies, economies, sectors, clients of those companies, cyclical exposure of those companies, etc. The same applies to investing in a single manager fund – if all your money is invested with one single manager, you are reliant on the performance of this manager, which will be driven by the many idiosyncratic decisions taken by this manager (including their philosophy and process, their team and all the individuals, their models and the assumptions used, etc.). Spreading your money across multiple managers, diversifies this idiosyncratic risk, minimizing the possibility that poor performance will negatively affect your overall portfolio performance.
In cricket – the best international teams have a balanced mix between solid batsmen that score at a slower defensive pace but accumulate lots of runs and some hard hitters that can quickly score fifty runs towards the end of an innings. Think of South African greats like Jacques Kallis and Lance Klusener. Although very different in their batting approach, these individuals complement each other and the team’s performance. Diversification in investments is very similar, and occurs when you spread your investments across different securities, asset classes, and managers. Some managers will do well when others do poorly, reducing the overall volatility or risk of your portfolio.
While this principle is generally well understood by most investors, some fail to recognise the additional opportunity of selecting great stocks or managers, in addition to diversification. Passive investing achieves diversification while potentially leaving the opportunity to outperform on the table. Similarly, arbitrarily choosing a number of managers to blend achieves diversification, but leaves the opportunity of outperforming by choosing and blending great managers on the table. For advisers, the problem is actually more serious, as the basis for their choice must be well researched and cannot be done on an arbitrary basis like based purely on past performance or on the size of a manager’s assets under management (AUM).
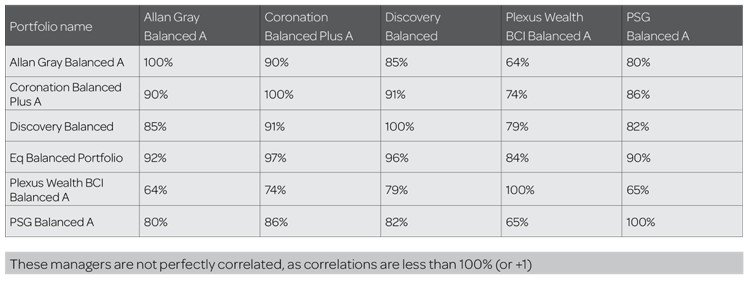
Correlation measures the extent to which two assets move together. When two assets always move up and down together, their correlation is +1; when they always move in the opposite directions, their correlation is -1 (a hedge); and when they move independently, their correlation is zero (great for diversification). The closer the correlation is to 0, the more diversification benefits can be achieved. A correlation of -1 is never ideal as it just represents a perfect hedge i.e. removing risk completely. It is important to note, and is often very poorly understood even by professional investors,as long as correlation is not perfectly positive at +1, diversification occurs i.e. two correlated assets still offer diversification. A well-diversified portfolio reduces risk without giving up returns.
Balanced example
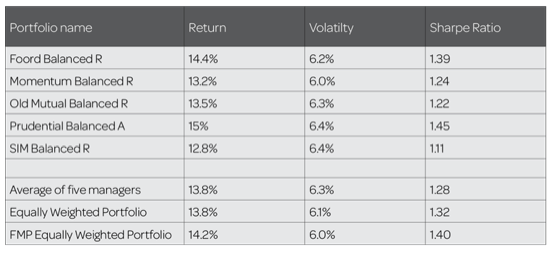
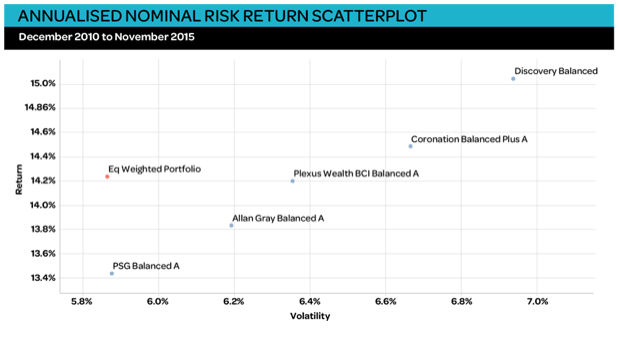
To illustrate the concept of improving risk-adjusted returns, five balanced single manager funds were selected. These managers were purely selected for illustration purposes and no recommendation is made about any of these managers. Although we picked five managers that illustrate our point quite well (by using managers with similar Sharpe ratios), the concept will apply regardless of the managers selected. A five year history was used to analyse the diversification benefit of blending these balanced portfolios. The illustration is presented in absolute terms and not relative to benchmark (active returns). The reason for this is that a balanced investor is probably more concerned about performance relative to an absolute measure like initial capital invested, cash or inflation. Note that different fee classes were used due to availability of information, which has an impact on performance. Again, we need to stress that the focus should not be placed on the actual performance of these managers but rather the illustration of the diversification benefits.
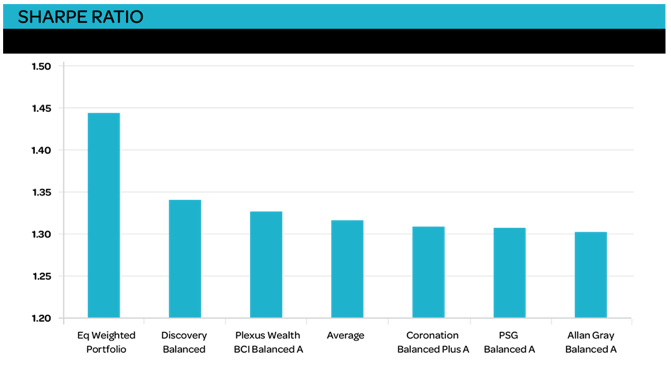
Had we combined these five funds in equal weights, the resulting portfolio would have had a return equal to the average return of the five managers but the volatility would have been less than any of the single managers at 6.4%. As long as these five managers are not perfectly correlated, the combined portfolio will always provide diversification benefits which will translate into higher risk-adjusted returns (Sharpe ratios).
Table 1: Correlation matrix of nominal returns
A very basic equally weighted strategy has therefore improved risk-adjusted performance significantly. This is not a random outcome, but a mathematical certainty.
You might ask why not just buy the manager with the best historical performance. The answer is quite simple, five years ago an investor would not have known which single managers would be the top performer in the subsequent five year period. The only certainty five years ago would have been the fact that combining managers would have resulted in better than average risk-adjusted returns.
An overview of the STANLIB Multi-Manager approach
STANLIB Multi-Manager does not simply invest naively (both equally weighted and every manager/fund) in single managers. Single managers are carefully selected (through a rigorous qualitative and quantitative manager research process) and expertly blended to achieve good diversification and excellent risk-adjusted returns.
Every single manager is different, even though there could be overlap on parts of their investment philosophy and process. While some single managers employ forward looking strategies (e.g. estimating future cash flows), others focus more on historical information (e.g. historical P/E ratios), and others utilise a combined approach (e.g. P/E ratios based on forward consensus earnings). This is only part of what makes managers different and managers may construct portfolios to have exposure to many different risk factors (e.g. rand or interest rate sensitive or defensive companies). These factors can play a critical role in driving a single manager’s performance. Not all investment philosophies and processes will perform well at all times, and it is important to understand which strategies have the best chance of outperforming over the longer term. As illustrated above, when managers are not perfectly correlated, diversification benefits are realised by blending them.
STANLIB Multi-Manager utilises qualitative and quantitative techniques to determine whether a manager is likely to be skillful going forward and how their portfolios are likely to behave in isolation and in relation to each other. They use this information to select and blend local and international single managers into funds that will offer excellent risk- adjusted returns.
Qualitative analysis includes a thorough understanding of the single managers’ investment philosophy, process, and people, which is gathered through on-going in-depth due diligence reviews and office visits.
Quantitative analysis incorporates various statistical tools, to measure and analyse risk and return numbers, and portfolio holdings over different time periods and in various economic environments. Although managers are considered in isolation, they are also always considered relative to benchmarks and their peers.
By investing in a STANLIB-Multi Manager fund, an investor gets the best of both worlds – access to leading single managers and a well-diversified single packaged solution, resulting in excellent risk-adjusted returns.